

Reading a forex chart can feel confusing when you are just starting out. Candlesticks move up and down, trends change direction, and sometimes the market appears to be moving without any clear structure, this is where forex chart patterns can become useful.
Chart patterns are visual formations created by price movement on a chart. Traders and technical analysts study these formations to understand the current market structure and find out the possible continuation, reversal, or breakout scenarios. They are not guarantees of what price will do next, but they can provide a clearer way for analysing price action.
In this guide, we will explain 10 popular forex chart patterns in simple language with examples so that beginners can understand what they look like, what they may indicate, and what are the things to keep in mind while analysing a forex chart.
What Do You Mean By Forex Chart Patterns?
A forex chart pattern is an easy to understand formation created by the movement of a currency pair’s price over time. These formations can appear on different timeframes, from short-term charts to daily or weekly charts. They can also be identified on different types of charts, including line, bar, and candlestick charts.
In simple terms, a chart pattern helps you understand simple teams such as current market conditions, and what could happen if the current structure breaks. Most traditional chart patterns can broadly be divided into three groups:
- Reversal patterns – It is helpful to suggest that the existing trend may change direction.
- Continuation patterns – Suggest that the existing trend may continue after a pause.
- Bilateral patterns – Can potentially break in either direction, so confirmation becomes particularly important.
Additionally, understanding this difference makes chart patterns much easier to study for every type of user.
What are the Top 10 Forex Chart Patterns in Forex Trading?
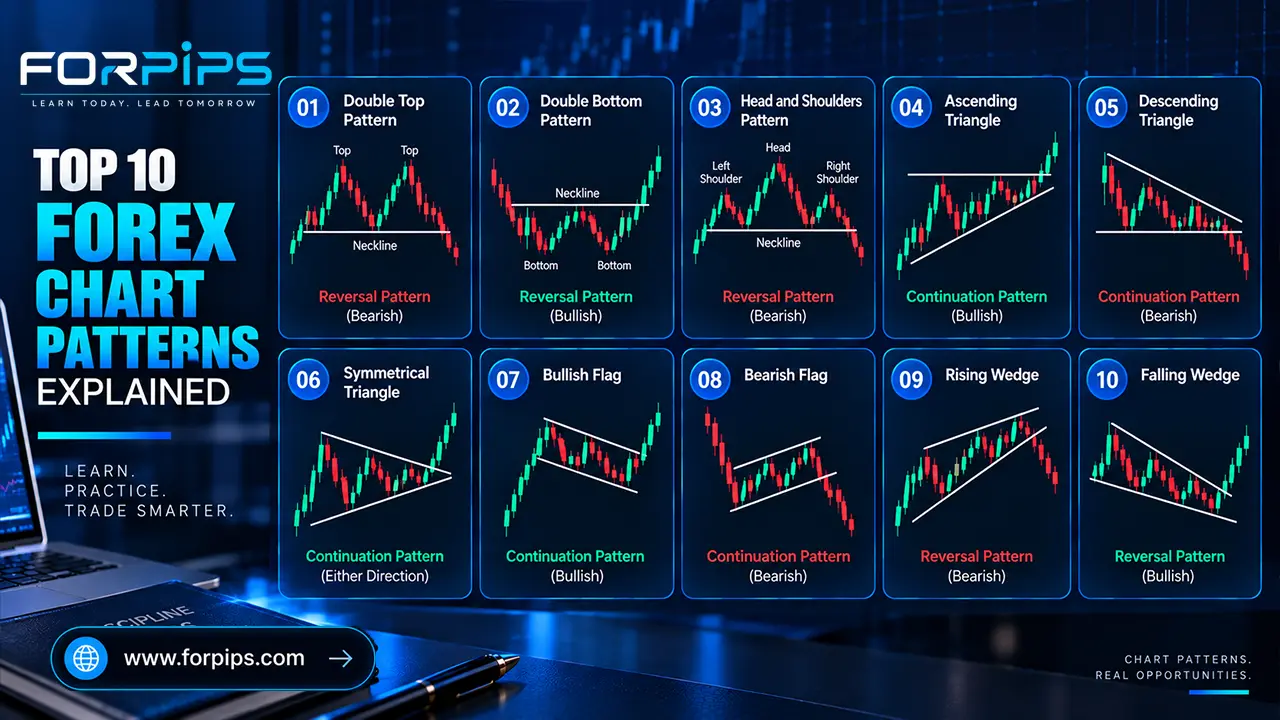
There are mainly top 10 major types of forex chart patterns, let’s review every type with examples.
1. Double Top Pattern
The Double Top is a classic bearish reversal pattern. It generally develops after an upward price movement. Price reaches a resistance area, pulls back, and then attempts to move higher again, if it reaches a similar high but fails to continue upward, a second peak is formed. The two peaks create a shape that looks similar to the letter M.
How to identify a Double Top
Look for:
- An existing uptrend
- First price peak
- Pullback toward a support area
- Second peak near the first peak
- A potential break below the support or neckline
The area between the two peaks is often called the neckline. A confirmed break below the neckline can provide evidence that the previous upward structure is weakening. However, traders should be aware that patterns can fail and false breakouts can occur.
2. Double Bottom Pattern
The Double Bottom is generally considered the opposite of a Double Top, it often develops after a downtrend. Price reaches a support area, moves upward, falls back toward a similar low, and then attempts to recover again. The formation resembles the letter W.
How to identify a Double Bottom
Look for:
- An existing downtrend
- First low
- Recovery
- Second low around a similar price area
- A potential breakout above the neckline
A move above the neckline can indicate that buyers are gaining control and that the previous rough structure may be weakening. Additionally, the important lesson for beginners is simple: do not treat the shape alone as confirmation, watch how price behaves.
3. Head and Shoulders Pattern
The Head and Shoulders is another widely recognized reversal formation. It normally consists of three peaks, the first one is Left shoulder, second one is Head, and the other one is Right shoulder
However, the middle peak, or the head, is higher than the two shoulders, a line connecting the important lows between these peaks is called the neckline.
What does Head and Shoulders indicate?
When the pattern develops after an uptrend, a break below the neckline may signal that the bullish structure is weakening and that a potential bearish reversal is developing.
However, the pattern should be viewed in context rather than treated as an automatic sell signal. The inverse version is called the Inverse Head and Shoulders, which develops after a downtrend and may indicate a potential bullish reversal.
4. Ascending Triangle
An Ascending Triangle is a triangle formation characterized by relatively similar highs while the lows gradually move higher. In simple terms, buyers are repeatedly pushing price upward from increasingly higher levels, while sellers are defending a relatively similar resistance area.
Key features of Ascending Triangle
- Horizontal or relatively flat resistance
- Rising support trendline
- Higher lows
- Price gradually moves toward the triangle’s narrower point
An upside breakout may suggest continuation of bullish momentum, but triangles can also break in the opposite direction. Therefore, confirmation is important.
Triangles are considered bilateral patterns because the eventual breakout direction is not guaranteed simply from the formation itself.
5. Descending Triangle
Descending Triangle is also a type of candlestick pattern which is broadly the opposite structure of an ascending triangle.
It usually contains relatively horizontal support and lower highs.
As price moves toward the end of the triangle, traders watch closely for a breakout. A downside break can indicate increasing selling pressure, while an upside break can invalidate the expected bearish scenario.
For beginners, the key takeaway is, a triangle shows compression; the breakout provides additional information about which side is gaining control.
6. Symmetrical Triangle
A Symmetrical Triangle forms when both the highs and lows gradually move toward each other, this creates two converging trendlines. Similar to some other triangle formations, a symmetrical triangle does not inherently tell you whether the breakout will be bullish or bearish.
If you are a beginner, keep things simple and focus on a few important points. First, look at the direction of the previous trend and then check which way the price breaks out of the pattern. Make sure the breakout candle actually closes outside the pattern, and pay attention to any nearby support and resistance levels.
Also, be careful of false breakouts, where the price briefly breaks out but then moves back inside the pattern.
7. Bullish Flag
A Bullish Flag is commonly associated with a temporary pause during an upward move. It typically consists of a strong upward price movement, sometimes called the flagpole, followed by a smaller consolidation that resembles a flag. The market may be taking a temporary pause rather than immediately continuing in a straight line.
Typical structure: Strong upward move → consolidation → potential upside breakout
A breakout above the flag’s upper boundary may support a continuation scenario. However, traders should remember that not every consolidation pattern produces a successful continuation.
8. Bearish Flag
The Bearish Flag is the counterpart to the bullish version, it generally appears after a strong downward price movement, followed by a smaller upward or sideways consolidation.
The structure can be viewed as: Strong downward move → consolidation → potential downside breakout
If price breaks below the lower boundary of the formation, traders may interpret it as confirmation of bearish continuation.
9. Rising Wedge
A Rising Wedge occurs when price moves upward inside two converging trendlines. Although both highs and lows may be rising, the trading range gradually becomes narrower.
The important point is that a rising wedge can have different interpretations depending on the surrounding market structure, it can appear as a reversal pattern or, in some contexts, as a continuation formation.
When looking at a wedge, beginners should focus on a few simple things. First, check the direction of the previous trend and look at how both trendlines are moving. Notice whether the price is gradually moving into a smaller range, and then watch for the eventual breakout.
Additionally, it is also important to check for nearby support and resistance levels.
10. Falling Wedge
The Falling Wedge is formed when price moves downward while the highs and lows converge, it is often watched for a potential bullish breakout, but like other chart patterns, it should not be interpreted in isolation.
A falling wedge can appear in different market contexts and may act as either a reversal or continuation formation. For beginners, focus less on memorising a fixed prediction and more on understanding the structure:
Price is contracting → the range becomes narrower → traders wait to see which side breaks.
Final Thoughts
Forex chart patterns provide beginners with a visual way to understand price behaviour, market structure, consolidation, breakouts, and possible reversals.
The most important patterns to learn include Double Top, Double Bottom, Head and Shoulders, Ascending Triangle, Descending Triangle, Symmetrical Triangle, Bullish Flag, Bearish Flag, Rising Wedge, and Falling Wedge. But remember: a pattern is a framework for analysis, not a guarantee of future price movement.
Start by learning one or two patterns at a time, study historical charts, mark the formations, observe what happened after the breakout, and practise identifying them on a demo account before considering real-money trading.
With consistent practice, you can gradually become more comfortable reading forex charts and understanding how different patterns fit into the bigger picture of technical analysis. Education comes first. Practice before participation, and always understand the risks involved in forex trading.
Also Read – GTCFX Risk Vs Reward Ratio
Frequently Asked Questions
Question. What is a forex chart pattern?
Answer. A forex chart pattern is a recognizable formation created by price movement that traders use as part of technical analysis to study potential continuation, reversal, or breakout scenarios.
Question. Which forex chart patterns should beginners learn first?
Answer. Beginners can start with simple formations such as Double Top, Double Bottom, Head and Shoulders, triangles, and flags before moving to more complex technical analysis concepts.
Question. Are forex chart patterns accurate?
Answer. No chart pattern guarantees a particular market outcome. Patterns can fail, and false breakouts can occur.
Question. What is the difference between reversal and continuation patterns?
Answer. Reversal patterns are studied for possible changes in the existing trend, while continuation patterns are studied for situations where the existing trend may resume after a pause or consolidation.
Question. Can forex chart patterns be used on any timeframe?
Answer. Chart patterns can appear across different timeframes, from short-term charts to longer-term charts, their interpretation should always consider the timeframe and broader market context.