

Suppose you are trying to understand where a football is going by watching how it moved before, you look at its direction, speed, and the way it changed. Technical analysis in forex trading works in a similar way.
Traders look at a price chart to understand how the price has moved in the past. They use this information to find possible future price movements. Technical analysis may sound like a difficult topic, but it becomes much easier when you learn it step by step. So, to make this complex top into easy to understand, stick around to our guide, to understand simply.
What Do You Mean By Technical Analysis?
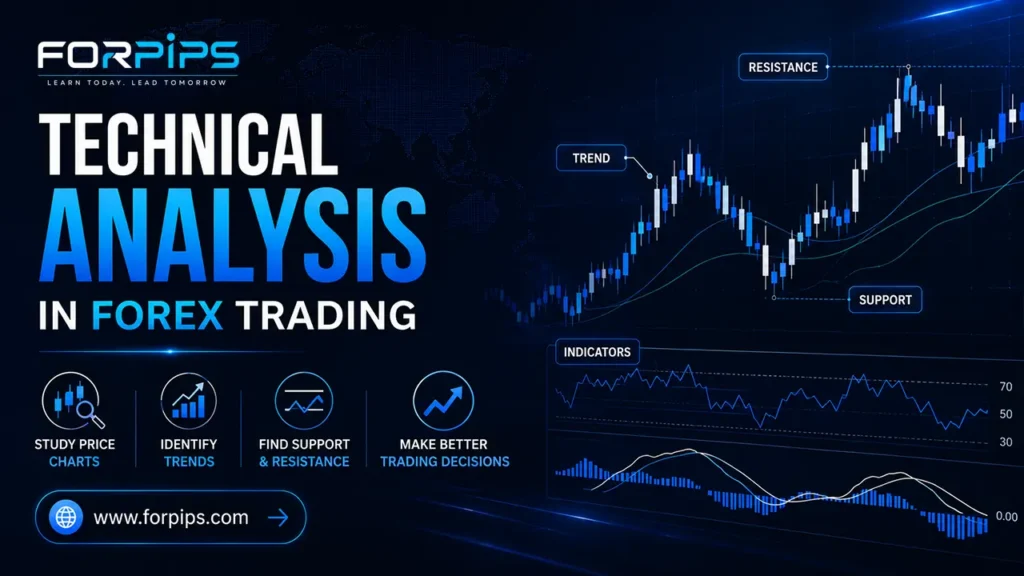
Technical analysis is a way of studying price charts to understand how a market is moving. In the place of only focusing on news or company information, technical traders focus on things such as, price, charts, trends, forex market structure, candlestick patterns, and trading volume.
Think of a price chart like a map, which helps you understand where you are and where you may go. In the same way, a forex chart helps traders understand where the price has been and where it might move next minute.
However, technical analysis does not tell us exactly what will happen. It only helps traders make decisions based on information available out there.
What Are Support and Resistance?
Support and resistance are important price areas on a chart. Think about a bouncing ball, if you throw a ball toward the floor, the floor stops it from going lower. The floor is like a support ,now imagine throwing the ball toward the ceiling. The ceiling stops it from going higher. The ceiling is like resistance. Now, let’s explore in depth.
What Is Support?
Support is a price area where buyers may become more interested in buying. It can sometimes stop or slow down a falling price. For example, imagine a currency pair repeatedly falls near 1.1000 but then moves upward.
Traders may consider 1.1000 an important support area. However, support is not always a perfect line, price can move slightly below or above an area before changing direction.
What Is Resistance?
Resistance is a price area where sellers may become more active, and it offers large benefits. It can sometimes stop or slow down a rising price. For example, if a currency pair repeatedly reaches 1.1200 but struggles to move higher, traders may watch 1.1200 as a resistance area.
What are the Common Candlestick Types of Patterns?
There are lots of candlestick patterns, let’s look at a few popular ones.
1. Doji Candlestick Pettern
A Doji usually has a very small body because the opening and closing prices are close to each other, it can show that buyers and sellers are uncertain. A Doji does not automatically mean that the price will reverse and before making a decision, traders typically examine the recent price action.
2. Hammer Candlestick Pettern
A Hammer has a small body and a longer lower wick, it can appear after a price decline and may show that buyers pushed the price back up from lower levels. Traders generally prefer to see confirmation before interpreting it as a potential move higher.
3. Shooting Candlestick Pettern
A Shooting Star usually has a small body and a long upper wick. It can appear after a price rise and may show that sellers pushed prices down from higher levels. Additionally, traders normally look for confirmation on the place of relying on one candle alone.
4. Engulfing Candlestick Pattern
An engulfing pattern utilises two candles. Forest one is a bullish engulfing pattern that can appear after a decline and may show stronger buying pressure. Another one is a bearish engulfing pattern that can appear after a rise and may show stronger selling pressure.
Candlestick patterns are useful, but one pattern should never be treated as a guaranteed signal.
What are the Common Mistakes Beginners Should Avoid?
Learning technical analysis takes time, but by following these mistakes a beginner should save his capital.
- Using Excessive Indicators
Utilising many indicators to a chart can make it confusing, especially if you are new. It is often better to understand basic concepts well before moving to other tools.
- Trading Every Candlestick Pattern
Not every Hammer, Doji, or Engulfing pattern will lead to a successful trade. Always consider the bigger market picture, to save your pocket.
- Ignoring Risk Management
Even a good technical setup can lead to a loss, that is why risk management is an important part of forex trading, that should be considered.
- Believing Technical Analysis Is Always Correct
Technical analysis cannot predict the future with certainty, unexpected news, economic events, and sudden market movements can change prices quickly.
- Trading Without Practice
Before risking real money, beginners should spend time learning, studying charts, and practicing in a demo environment.
Final Thoughts
Technical analysis in forex trading is like learning how to read a map. It helps traders understand where the market has been, what direction it may be moving, and which price areas deserve attention.
For beginners, start with the basics:
Market Structure → Support & Resistance → Candlestick Patterns → Trend Analysis
Once you understand these ideas, reading a forex chart can become much easier. The goal is not to predict every single price movement. The goal is to understand the market better, make more informed decisions, and manage risk carefully.
Learn slowly, practice regularly, and never treat any technical setup as a guaranteed way to make money.